日本株の「三角保ち合い」収束、上放れ?/Is Japanese equities evacuating from Triangle Hold and released upward?
日本株の『三角保ち合い』がやっと収束?
Is “Triangle Hold” in Japanese markets converging?
(English text continues to the latter half of the page)
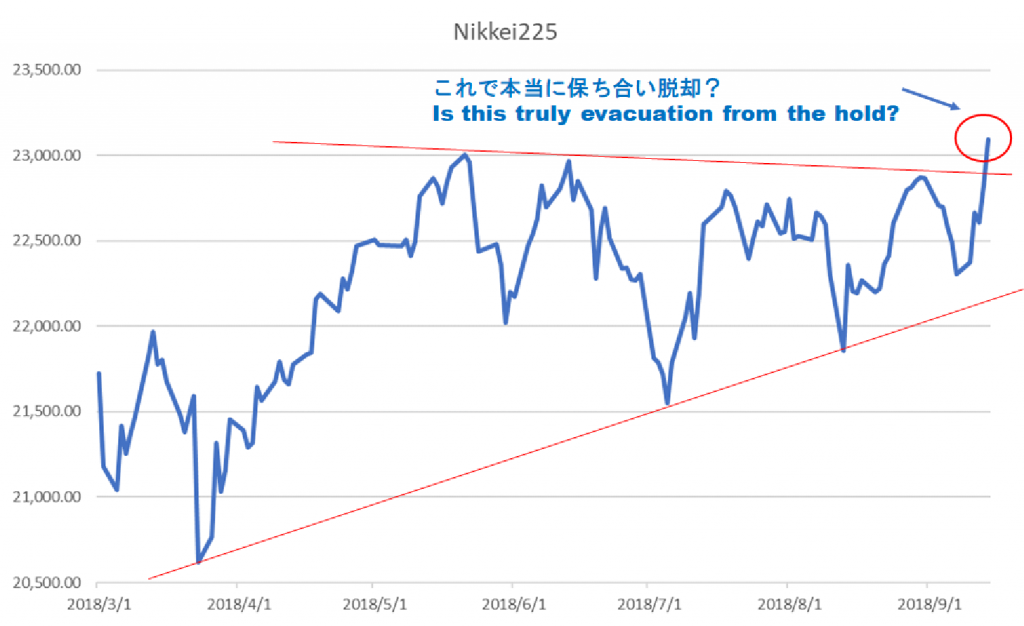
自分が資産運用の世界で働いていた時に基本としていたのはあくまでファンダメンタルズ分析、ミクロとマクロの経済状況から企業価値と相場の動きを分析するもの。チャートの形状から次の相場の動きを予想するテクニカル分析は専門ではなかった。とは言っても何十年も証券会社で働いてきただけに、チャートを眺めるのは大好き。特に今年春以降の日経平均のチャートを観ると絵に描いたような『三角保ち合い』になっていたので、いつどちらの方向に相場が放れるのか興味深く見ていた。『三角保ち合い』とは相場の振幅が徐々に狭まっていくことによって、下方の支持線と上方の抵抗線が三角形の形に収束していくチャートの形状。支持線と抵抗線が交わって三角形の頂点が出現する前に、相場は上方か下方のどちらかに大きく動くことが期待されるチャートだ。
日本株の三角保ち合いは下の図のように先週末になって遂に保ち合いを上に放れた。今週に入っても、NY市場の動向にほとんど影響を受けないまま“勢いづいた”ように値上がりを続けている。

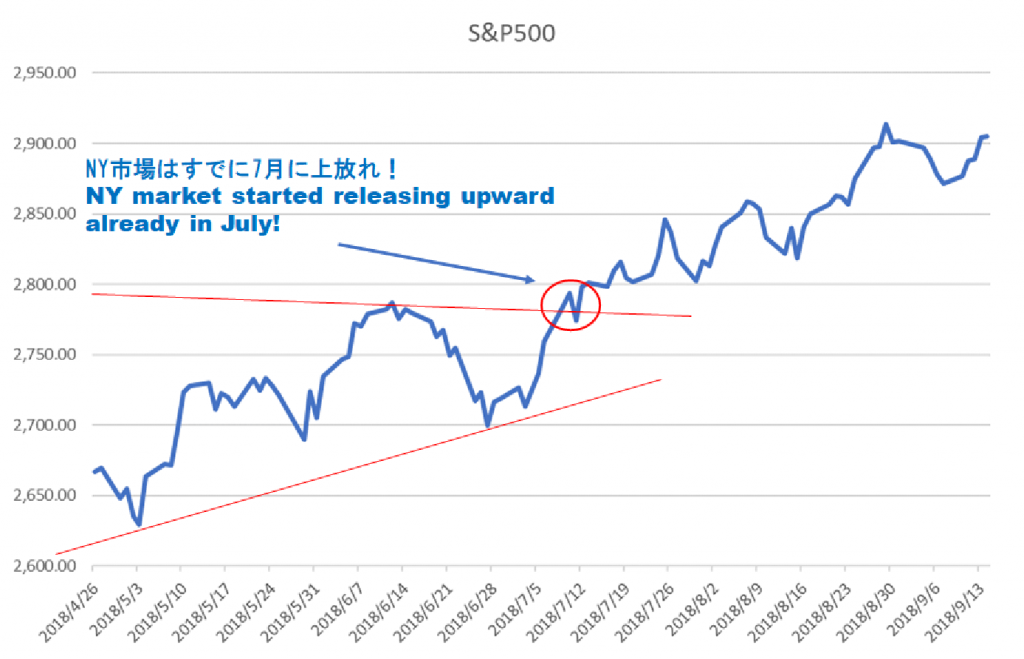
これで日本株は久しい調整場面を脱したものと考えてよいのか?実は日本市場よりも前に、NY市場は7月にすでに三角保ち合いを上に大きく放れている。

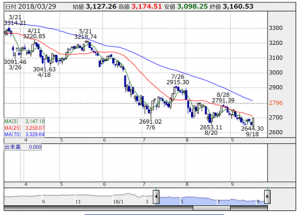
そして逆に大きく下放れを始めているのが中国株式市場だ(下図は上海総合指数の推移)。こうしてみると今年の3月以降に世界の株式市場で起こってきたことは、まず米中の間の貿易戦争、その結果として米の勝利、中国の苦境、そしてトルコ、新興国での通貨弱体化(まだ通貨危機という文言は不適当か)と、そしてその結果として欧州を敬遠して日本株を“消去法的に”に買うといったことではないだろうか。

米中戦争:短期的に中国の負けは明らか、チキンランの行方は?
株式市場の動きを見る限り、米中の貿易戦争は短期的にアメリカの勝利、中国の敗北と言うことは明白だ。景気が高水準にとどまっている限り中国にとってPC、情報機器のアメリカ向け輸出は生命線で、このチャンネルを押さえられるのはきわめて辛い。さらにトランプ大統領のもう一つの懸案である「北朝鮮の非核化」に関連しても、北朝鮮が頼りにするのは中国なので、その意味でも中国への経済的なプレッシャーは重要な牽制になる。
ただトランプ政権が中国へこのまま攻撃を続けていて、必ずしも長期的な勝利が約束されているとは限らない。現在のアメリカの優勢を支えているのは、米ドルが世界の基軸通貨であるという事実だ。もしも世界の企業が人民元で決済できるのであれば中国もここで苦境に陥ることはない。世界の基軸通貨というからには米国債は世界中の中央銀行に保有されている。しかしその海外保有割合はリーマンショック直前の55%から、直近では43%まで減少している。中国はその中でも18.9%を保有する最大のドル保有国だ(2位は日本の16.6%)。アメリカの基軸通貨国としてのポジションが弱まるかもしれない中で、このまま中国を際限なく追い詰めてしまえばアメリカ自身の首を絞めることにもなりかねない。アメリカにしても今回の関税発動は、崖に向かって全速力で走りながらぎりぎりのポイントで急停止するという“チキンラン”そのものではないか。
日本株は中国とアメリカの両方の景気に足をかけている。これまで中国国内でアッセンブリーしていたハイテク製品にハイスペック部品を供給していた日本のパーツメーカーには短期的に大きな打撃、また中国の内需に寄り添っていた化粧品、消費者製品もセンチメンタルは悪化するだろうが、逆にアメリカ向けに潤う工業製品、自動車などは買戻しが進んでいる。アメリカから2か月遅れで三角保ち合いを脱却した日本株市場を観ると、こうした米中の間に位置する日本経済への評価が時間差を以て現れたような気もする。この動きがいったいどのくらいにサステイナブル(持続可能)なものなのか、見定めるにはもう少し時間が必要になりそうだ。
Is “Triangle Hold” in Japanese markets converging?
When I had been involved with asset management, my main method was always fundamentals analysis which analyses directions of micro and macro economy, not technical analysis which tells the next direction from chart pictures. However I like to observe stock price charts as I have been working in securities brokers for many years. Especially the triangle hold of Japanese stock markets since spring time was quite curious and I have kept close watch on this. Triangle hold is the chart figure which is seen when daily volatility is gradually lesser. As a result lower supporting line and upper resistance line is converging to form triangle. Before this conversion the stock price tends to be released widely either in upward or downward.
The chart of Nikkei Average Index showed finally evacuation from the triangle into upward last weekend. It is showing very steady and strong movements even this week as if it was released from the yoke

Is Japanese stock markets truly evacuating the long consolidation phase? On the other hand, NY stock markets have evacuated from triangle hold already in July like below.

And Chinese stock markets have shown very contrast picture. The next chart is Shanghai composite index. It has been released very widely into downward since the spring time. Then I recognize what have happened in global stock markets since last March were;
Trade wars between US and China, results are US victory and China defeat, deterioration of Turkey and emerging currencies (the word “Currency crisis” is too early to use) , and its result is to take a distance from European markets and to buy Japan by elimination method.

US-China trade war: In short run, Chinese defeat is clear, where is “Chicken run” heading to?
As far as observing global equity markets, it is quite clear that US has won the trade war . Chinese exports of high-tech products to US is crucial point for Chinese economy and it is painful for China to lose this channel. Moreover North Korea where President Trump hurries denuclearization relies on China. So pressure to China is an important restraint for diplomatic tactics on North Korea.
However long term victory is not guaranteed if US sticks to current aggressive tactics. The fact of “$US as global reserve currency” is sustaining current US advantages. If global firms could clear their international deals in Chinese Yuan, China would never fall into current difficulties. $US is reserved by most of Central Banks in the world. But its proportion of foreign holdings has come down from 55% in 2008 to 43% recently. China has the biggest holding of 18.9% (the second is 16.6% by Japan) among them. As the absolute position as global reserve currency is weakens, the tactics to hunt down China could turn into kicking US itself. Even Trump Government must recognize that this is something like “Chicken run”.
Japanese economy depends on both sides of US and China. Japanese high-spec electronics parts makers who have supplied parts for Chinese assembly makers would have negative impact as well as cosmetics and consumer products makers which were profited along Chinese demands. On the other hand, industrial manufacturing and Automobiles which had been heavily depressed are now quickly recovering. Japanese market has evacuated from triangle hold 2 months later than US markets. It seems like investors had struggled how to value Japanese equities which is positioned between US and China. It is a big issue how sustainable current movement is. We might need some more time to have a consequence.
